Data report
India Patent Filing Report 2026
Filings, grants, applicants and examination times at the Indian Patent Office, from IP India records as of 21 October 2026.
By Raj Sutariya, Co-founder, PatentAssist.ai. Published .
Key findings
- Patents granted in India fell 71% in a year, from 64,921 in 2024 to 18,939 in 2025, after 76,019 in 2023.
- Academic institutions were named on 44.8% of applications filed in 2025, up from 36.0% in 2024 on the same publication window.
- 18 of the top 25 patent applicants in 2025 were Indian academic institutions, and Saveetha Institute (2,493 applications) was second only to Qualcomm (2,561).
- Indian applicants filed 65.7% of applications in 2025, up from 28.2% in 2020, but received 38.8% of the patents granted in 2025.
- AI and machine learning filings (IPC G06N) grew 279% from 2022 to 2025, to 13,431 applications.
- The Chennai patent office received 44.4% of applications filed in 2025, overtaking Delhi at 38.6%.
- The median wait from an examination request to the first examination report fell from 21.6 months for patents granted in 2023 to 7.2 months for those granted in 2025.
Counts are of published applications on record, so recent years are incomplete; growth figures compare years on the same publication window (see methodology). Download the summary tables (CSV).
Patent grants fell 71% in 2025
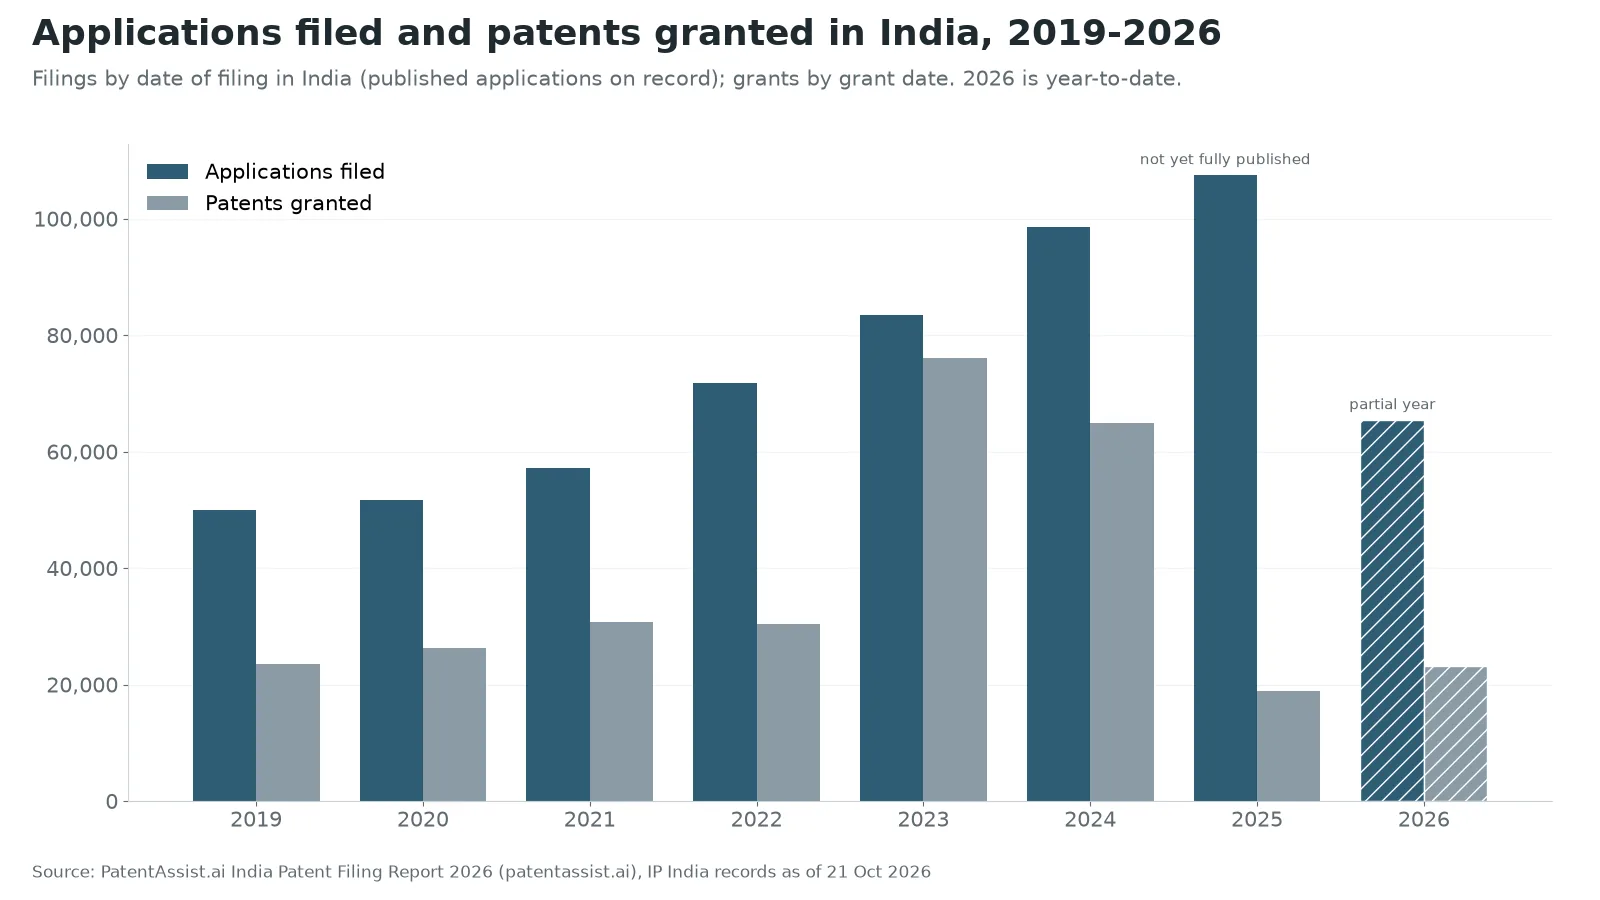
India granted 76,019 patents in 2023 and 64,921 in 2024 by grant date, then 18,939 in 2025. Applications kept rising over the same years. April to September 2025 saw only 6,541 grants. Grants are recovering in 2026: 23,141 by 30 September, already more than in all of 2025.
The official totals show the same pattern by financial year. The Office of the CGPDTM's Annual Report 2024-25 (page 9) records 103,057 patents granted in 2023-24 and 33,504 in 2024-25. Our records give 103,027 and 33,486 for the same periods. Patent numbers issued in 2025 span about 19,900 numbers, a third, independent check.
Embed this chart
<a href="https://patentassist.ai/india-patent-report-2026/#grants"><img src="https://patentassist.ai/reports/india-2026/01-filings-grants-per-year.webp" alt="Bar chart: patents granted in India fell from 76,019 in 2023 and 64,921 in 2024 to 18,939 in 2025, while published applications kept rising." width="800" height="450"></a><p>Source: <a href="https://patentassist.ai/india-patent-report-2026/">PatentAssist.ai India Patent Filing Report 2026</a></p>
Academic institutions file close to half of India's patent applications
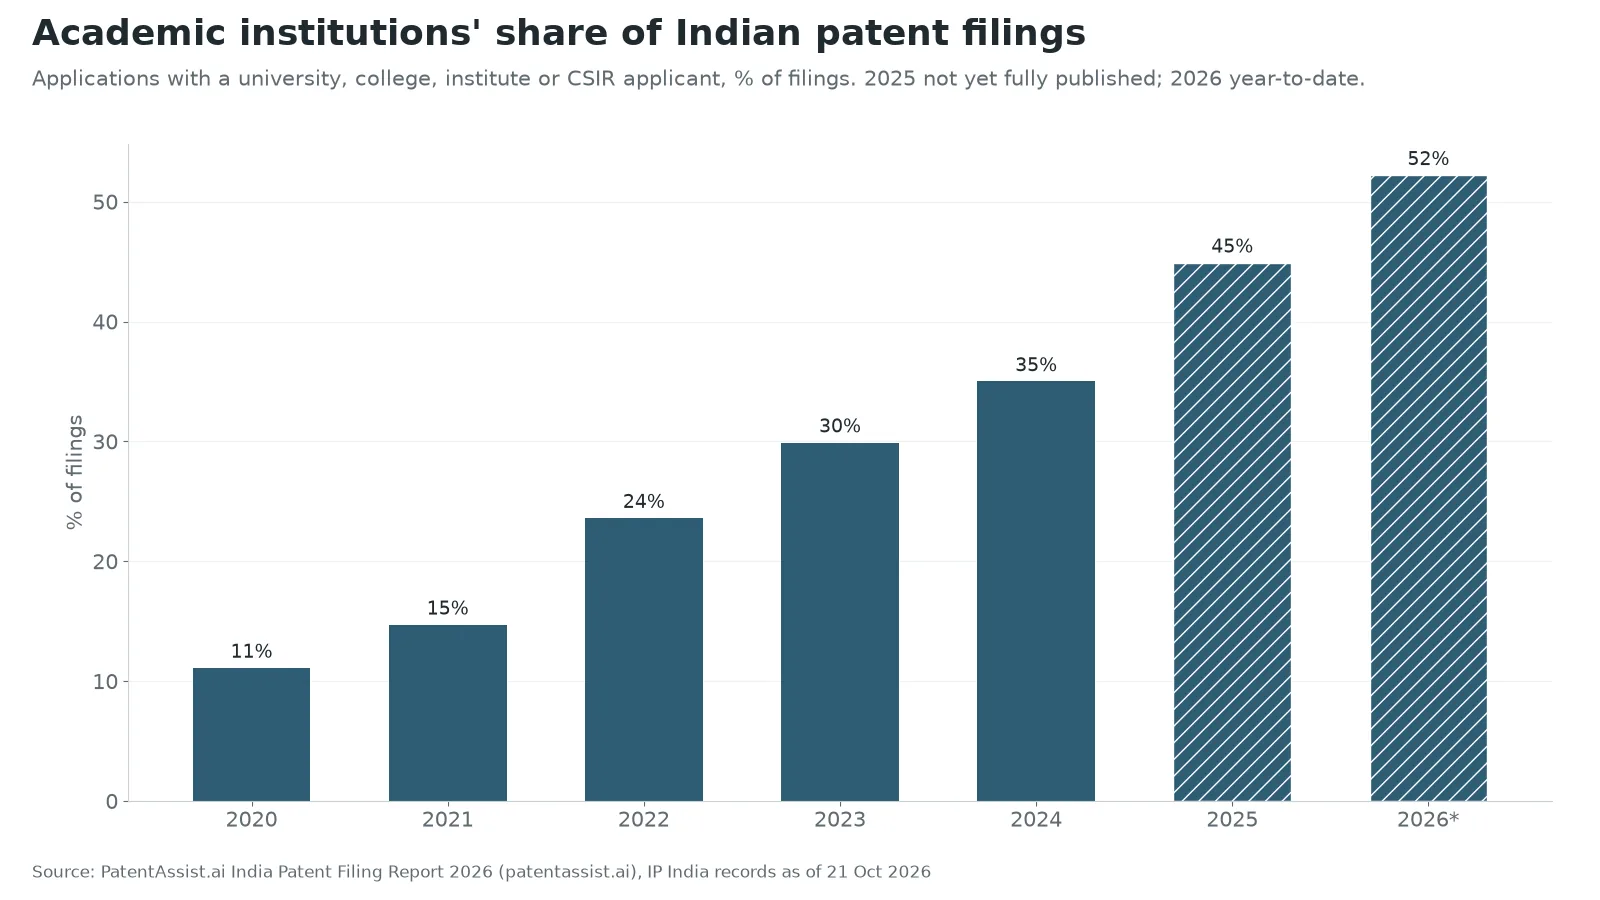
Universities, colleges, institutes and CSIR were named on 11.1% of applications filed in 2020 and 35.0% of those filed in 2024. On the same publication window, the share went from 36.0% for 2024 filings to 44.8% for 2025 filings.
18 of the top 25 applicants in 2025 were Indian academic institutions. Some grew more than five-fold in a year: Vellore Institute of Technology from 158 applications to 1,490, Siksha 'O' Anusandhan from 115 to 894, and Noida Institute of Engineering and Technology from 56 to 706. A filing is not a grant, and these counts say nothing about the quality of the research behind them.
Embed this chart
<a href="https://patentassist.ai/india-patent-report-2026/#universities"><img src="https://patentassist.ai/reports/india-2026/10-academic-share.webp" alt="Bar chart: academic institutions' share of Indian patent filings rose from 11% in 2020 to 35% in 2024 and 45% in 2025." width="800" height="450"></a><p>Source: <a href="https://patentassist.ai/india-patent-report-2026/">PatentAssist.ai India Patent Filing Report 2026</a></p>
Indian applicants file most applications but receive a minority of grants
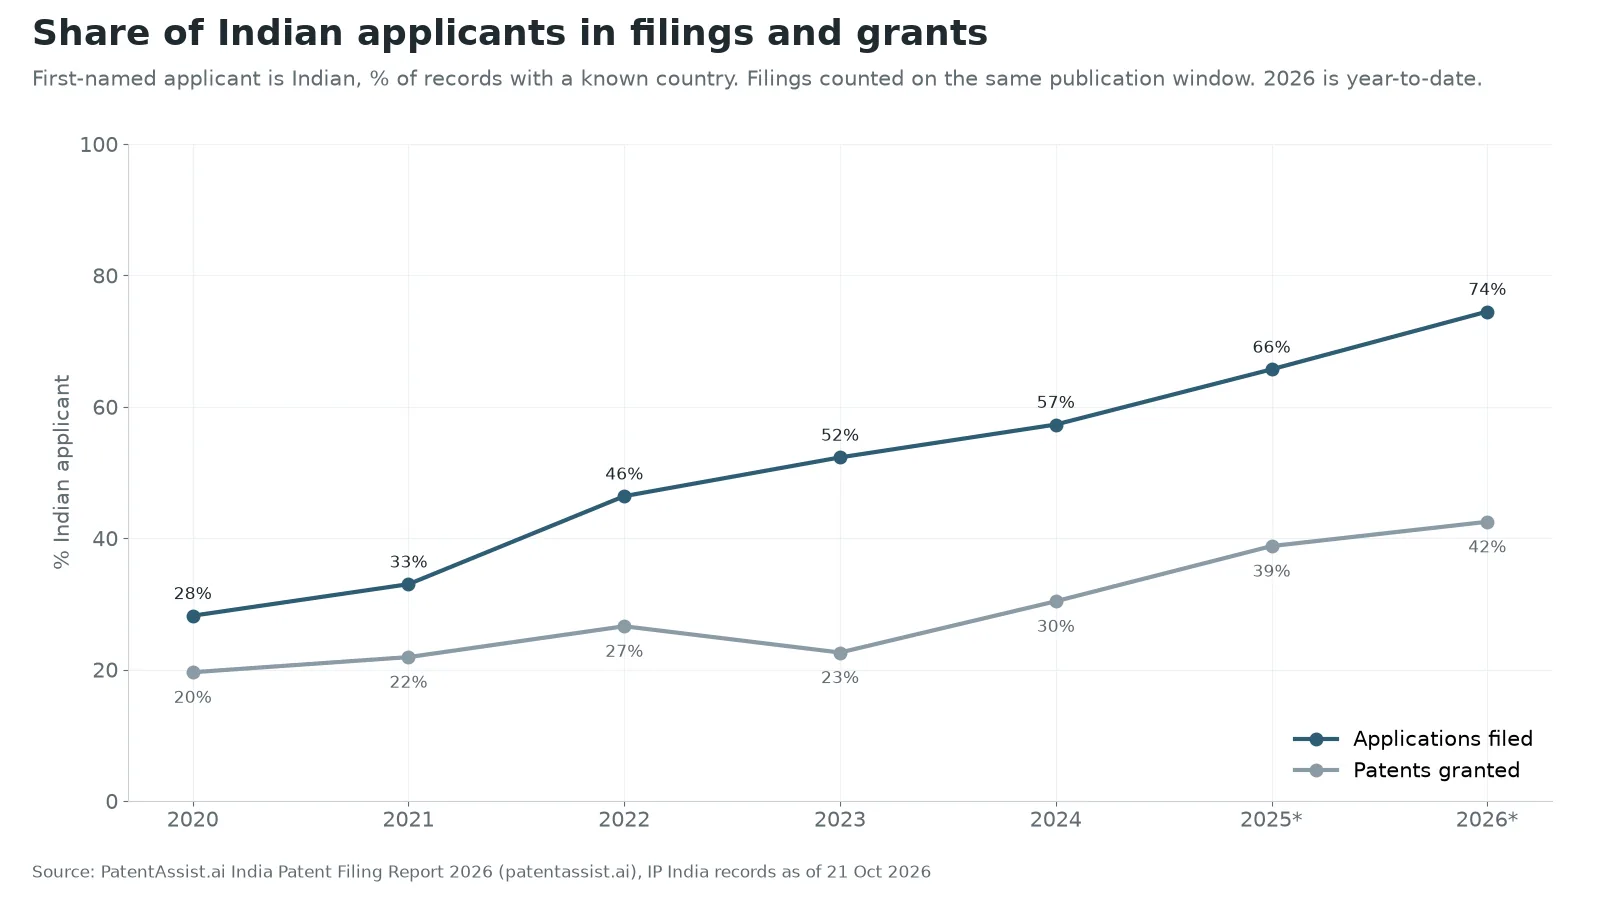
Indian applicants (the first-named applicant is based in India) filed 28.2% of applications in 2020 and 65.7% in 2025, counting each year on the same publication window. The official figure for 2024-25 is 61.79% (68,201 of 110,375), per the CGPDTM Annual Report.
Indian applicants received 38.8% of the patents granted in 2025. Of applications filed in 2018 to 2020, 44.2% of those from Indian applicants have been granted so far, against 66.7% of those from foreign applicants.
Embed this chart
<a href="https://patentassist.ai/india-patent-report-2026/#indian-applicants"><img src="https://patentassist.ai/reports/india-2026/02-domestic-share.webp" alt="Line chart: Indian applicants' share of filings rose from 28% in 2020 to 66% in 2025, while their share of grants reached 39% in 2025." width="800" height="450"></a><p>Source: <a href="https://patentassist.ai/india-patent-report-2026/">PatentAssist.ai India Patent Filing Report 2026</a></p>
AI filings almost quadrupled since 2022
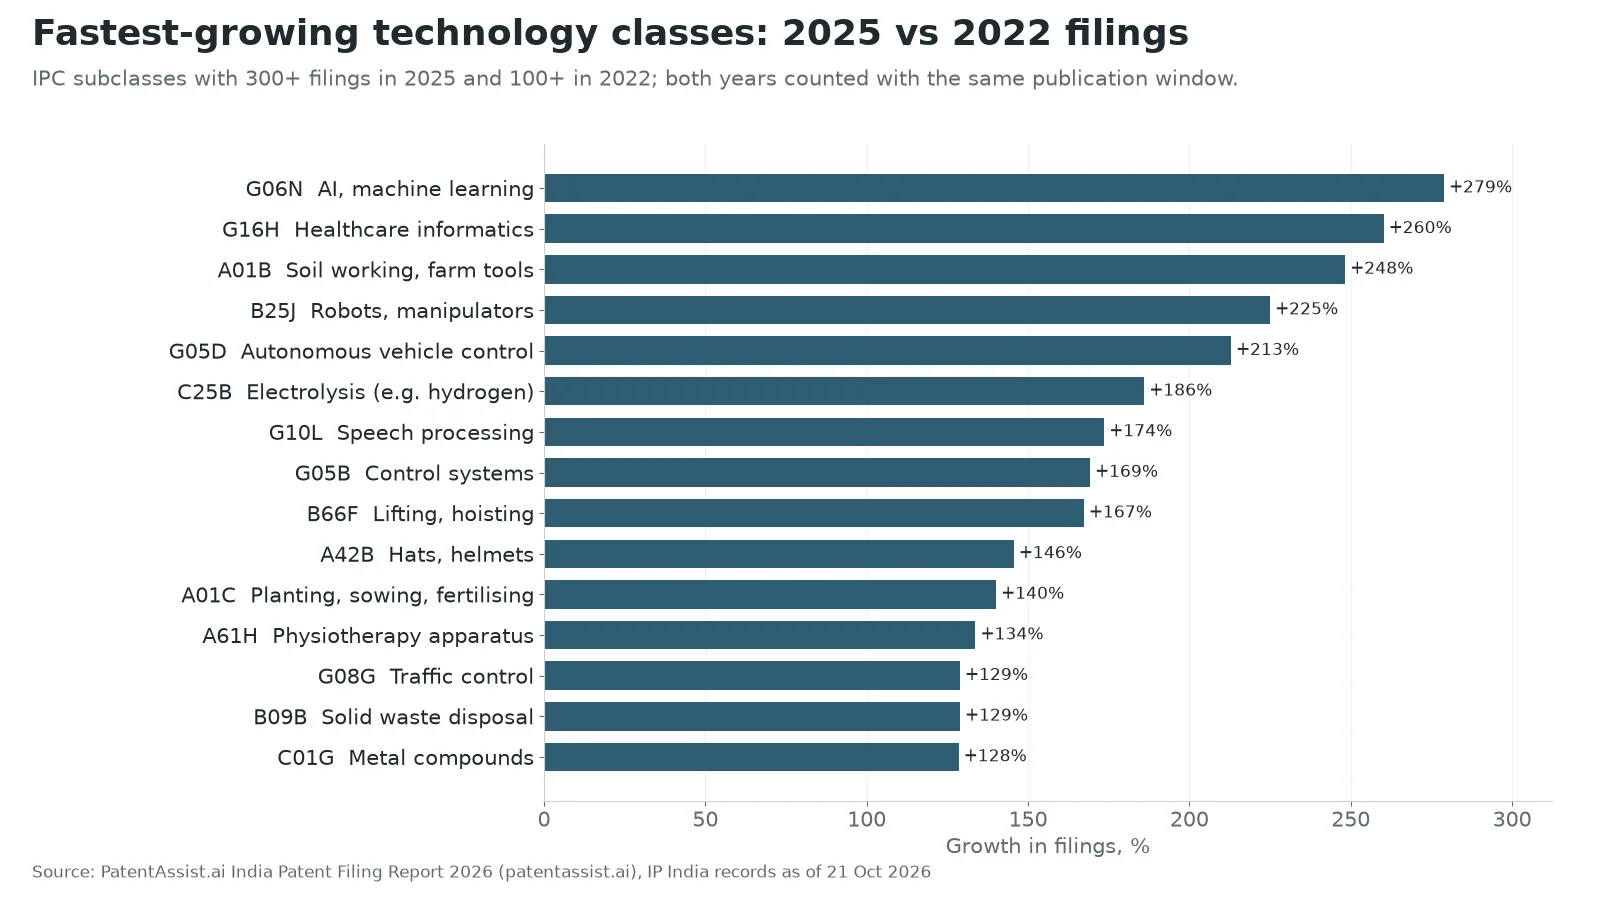
Applications classified in IPC subclass G06N (computing based on specific models, including machine learning and neural networks) went from 3,545 for 2022 to 13,431 for 2025 on the same publication window, a rise of 279%. G06N is now the second-largest subclass, after G06F (15,626).
The next fastest-growing classes are healthcare informatics (G16H, +260%), robots (B25J, +225%) and autonomous vehicle control (G05D, +213%). Newly created or reclassified subclasses such as G06V are left out, because their growth would reflect the reclassification.
Embed this chart
<a href="https://patentassist.ai/india-patent-report-2026/#ai-filings"><img src="https://patentassist.ai/reports/india-2026/07-ipc-fastest-growing.webp" alt="Bar chart: AI and machine learning filings (IPC G06N) grew 279% from 2022 to 2025, the fastest of any established technology class, ahead of healthcare informatics at 260%." width="800" height="450"></a><p>Source: <a href="https://patentassist.ai/india-patent-report-2026/">PatentAssist.ai India Patent Filing Report 2026</a></p>
Chennai overtook Delhi in 2025
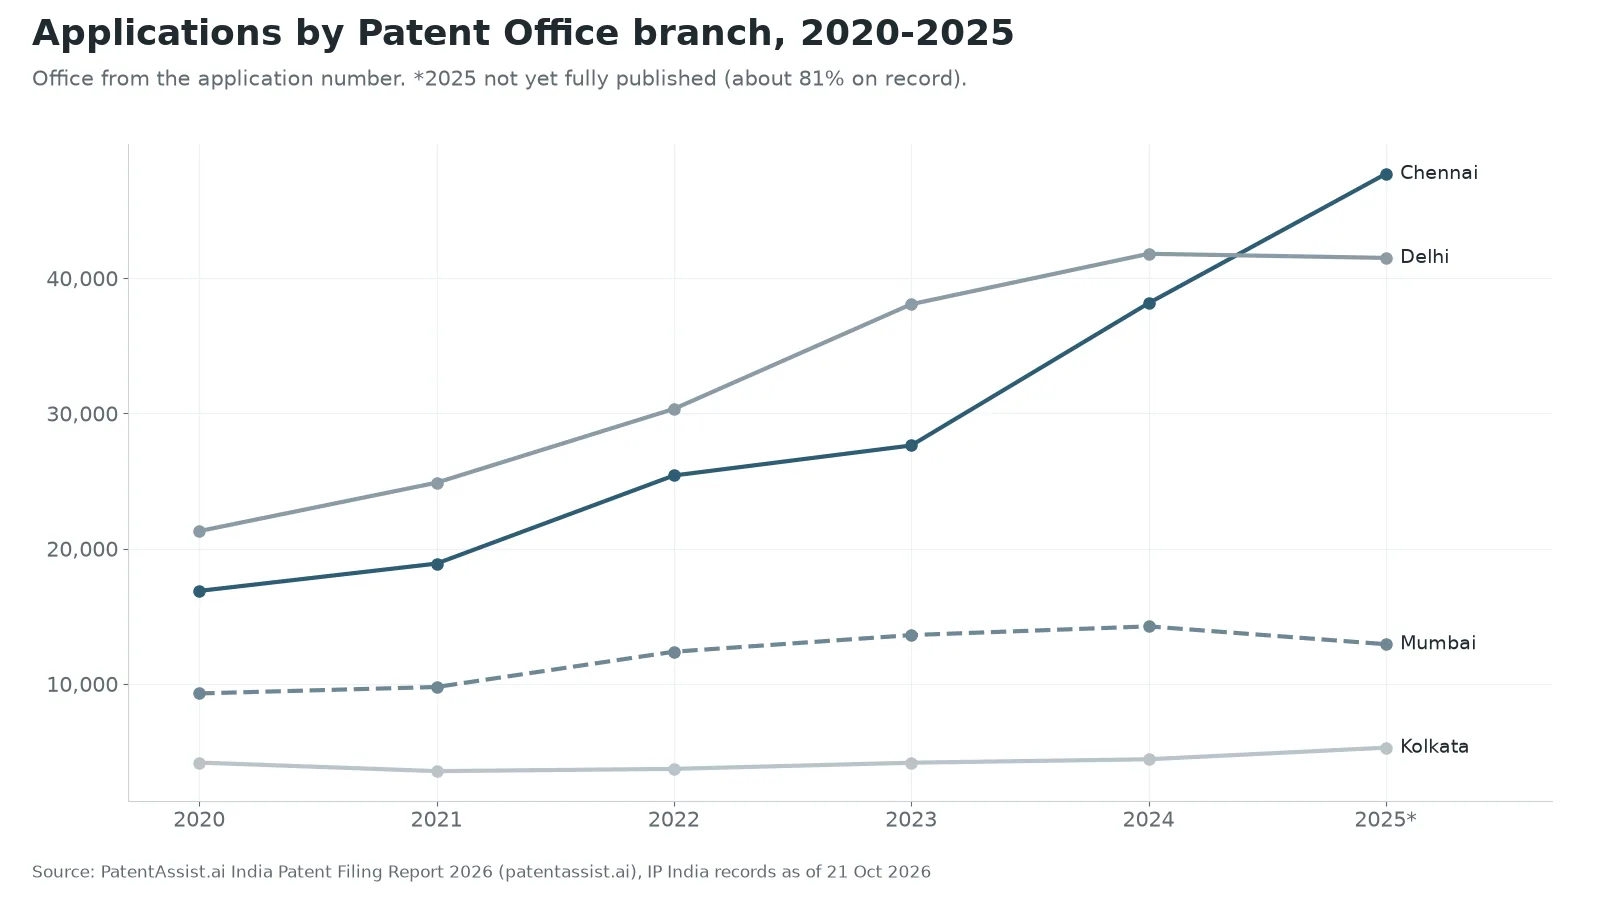
The Chennai branch of the Patent Office received 47,722 of the published applications filed in 2025 (44.4%), against 41,506 for Delhi (38.6%). In 2020 Delhi led with 41.2% to Chennai's 32.7%. Mumbai had 12.0% in 2025 and Kolkata 4.9%. An application's office is read from its application number.
Embed this chart
<a href="https://patentassist.ai/india-patent-report-2026/#patent-offices"><img src="https://patentassist.ai/reports/india-2026/03-filings-by-office.webp" alt="Line chart: the Chennai patent office received 47,722 published applications filed in 2025, overtaking Delhi at 41,506." width="800" height="450"></a><p>Source: <a href="https://patentassist.ai/india-patent-report-2026/">PatentAssist.ai India Patent Filing Report 2026</a></p>
The wait for a first examination report has shortened
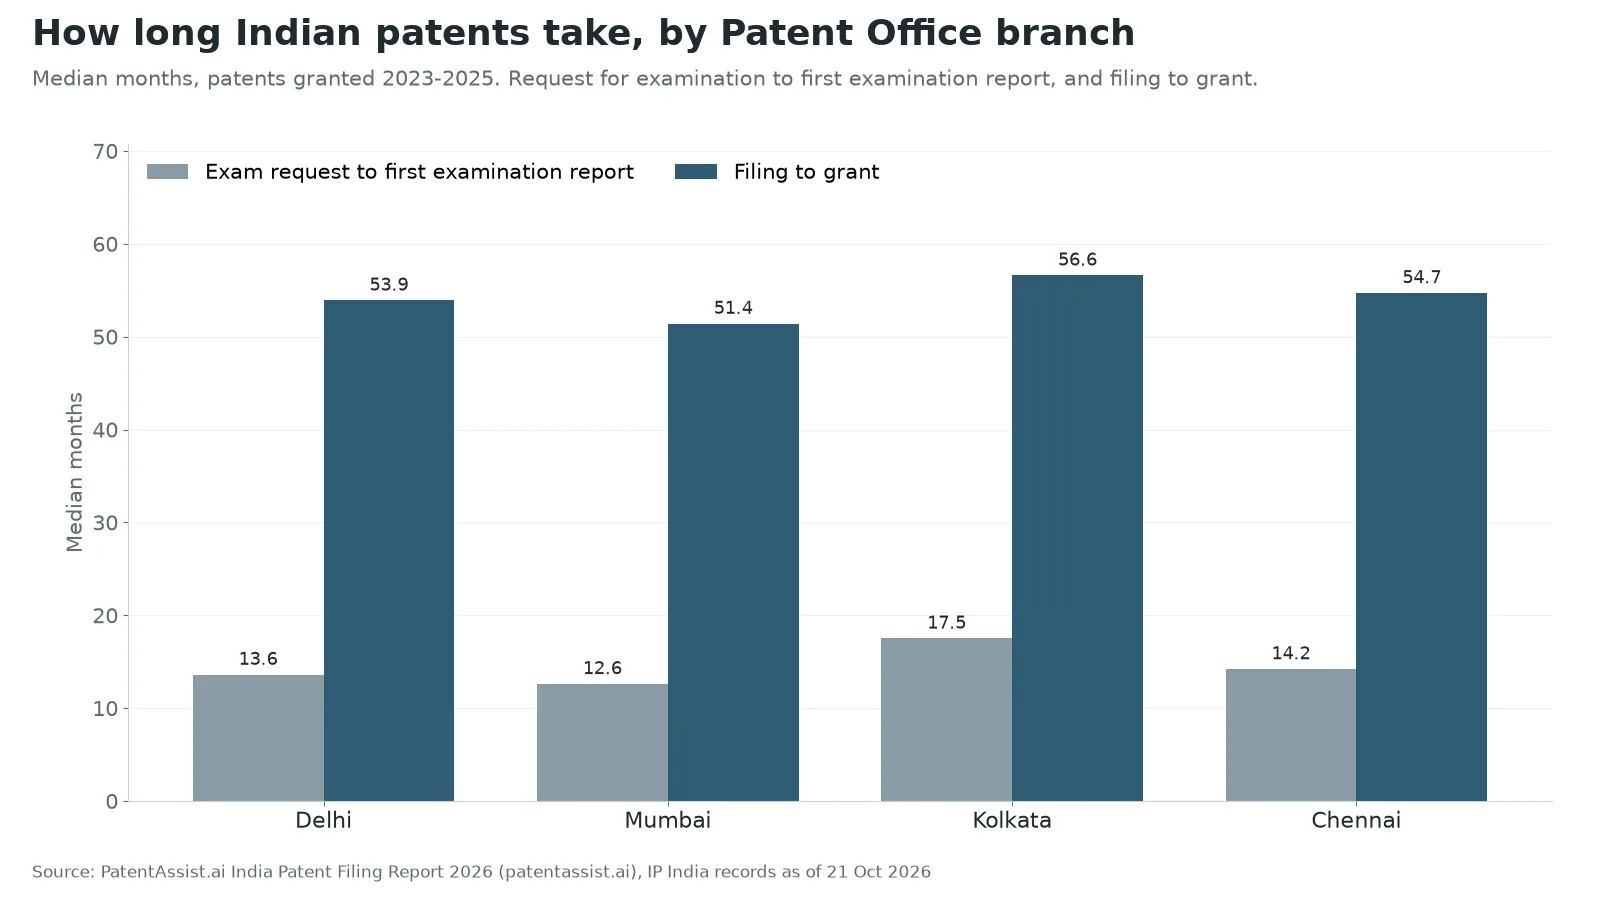
For patents granted in 2023, the median time from the request for examination to the first examination report (FER) was 21.6 months. For patents granted in 2025 it was 7.2 months. The median time from filing to grant fell from 64.8 months to 41.1 months over the same period.
Across all patents granted in 2023 to 2025 (159,879), the median wait from exam request to FER was 17.5 months at Kolkata and 12.6 months at Mumbai. These figures cover granted applications only. See the Indian patent timeline for the statutory deadlines and the Form 18 guide for requesting examination.
Embed this chart
<a href="https://patentassist.ai/india-patent-report-2026/#examination-time"><img src="https://patentassist.ai/reports/india-2026/08-timing-by-office.webp" alt="Bar chart: median months from exam request to first examination report, patents granted 2023 to 2025, was 17.5 at Kolkata and 12.6 at Mumbai." width="800" height="450"></a><p>Source: <a href="https://patentassist.ai/india-patent-report-2026/">PatentAssist.ai India Patent Filing Report 2026</a></p>
59% of applications filed in 2018 to 2020 have been granted
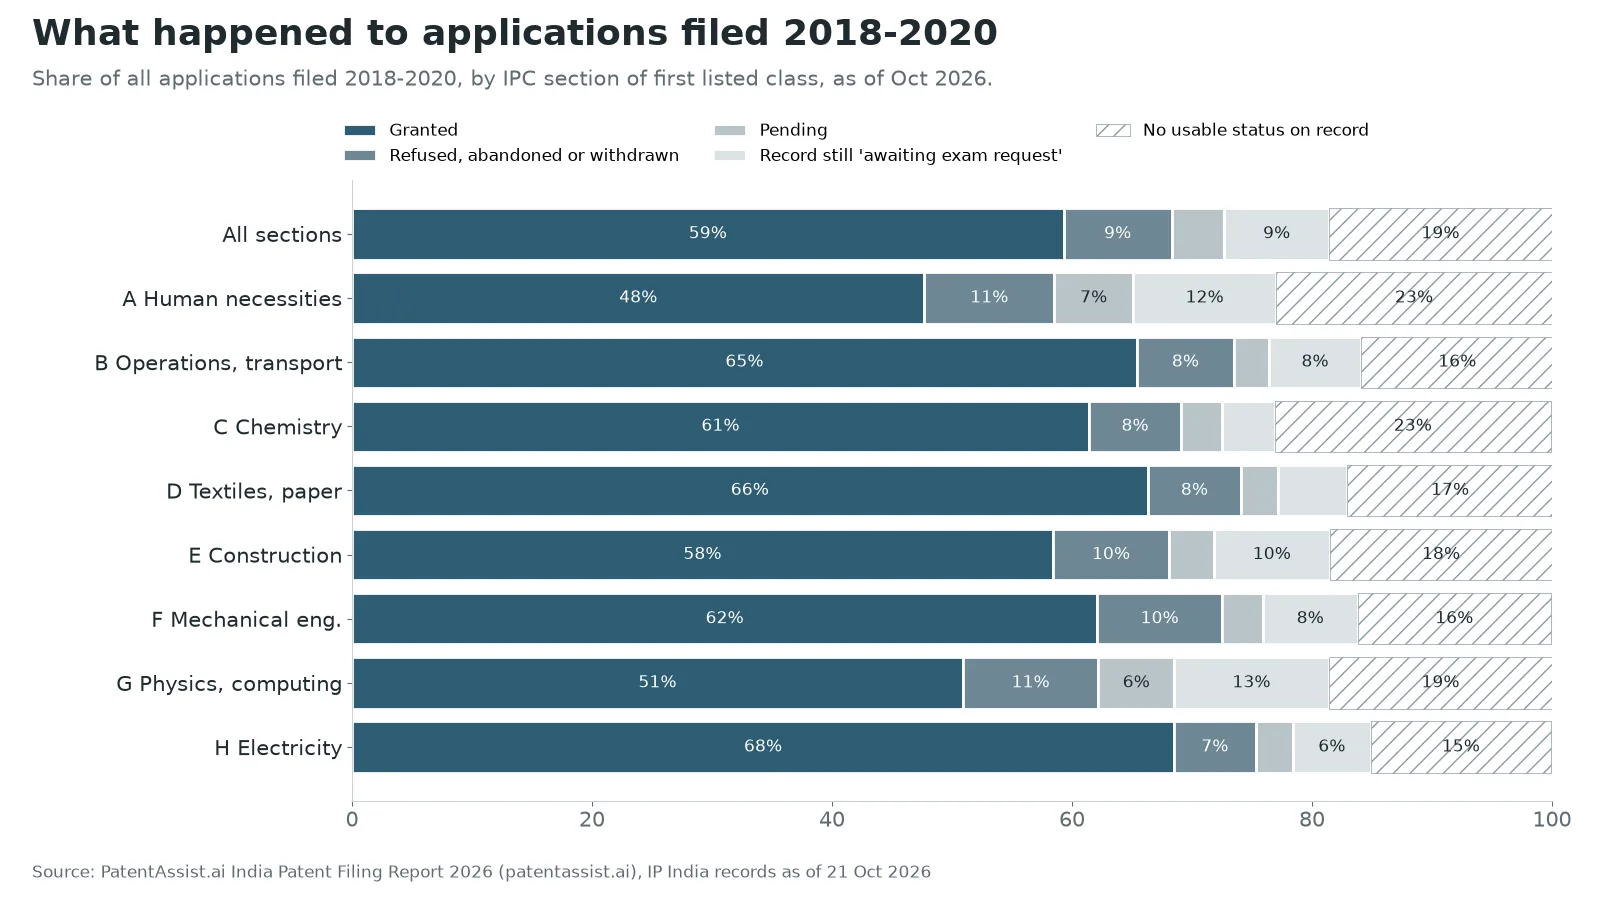
Of the 146,969 applications filed in 2018 to 2020, 59.3% have been granted. Refusals are rare at 1.1%. Physics and computing (section G, 50.9%) and human necessities (section A, 47.7%) have the lowest grant shares, and electricity (section H, 68.5%) the highest.
18.6% of these records carry no usable status, so the shares of abandoned and withdrawn applications are lower bounds. The granted share is reliable.
Embed this chart
<a href="https://patentassist.ai/india-patent-report-2026/#outcomes"><img src="https://patentassist.ai/reports/india-2026/09-outcomes-2018-2020-by-section.webp" alt="Stacked bar chart: 59% of applications filed in India in 2018 to 2020 have been granted, from 48% in section A to 69% in section H." width="800" height="450"></a><p>Source: <a href="https://patentassist.ai/india-patent-report-2026/">PatentAssist.ai India Patent Filing Report 2026</a></p>
Top applicants and patentees, 2025
Spellings of the same applicant are merged, but separate campuses stay separate: Vellore Institute of Technology and VIT Chennai together would rank 3rd with 2,096. Each name links to its page on PatentAssist's 2025 rankings, which may differ slightly from these tables (see limitations).
Top 25 applicants by applications filed, 2025
Published applications filed in 2025 and on record by 21 October 2026.
Embed this ranking as a chart
<a href="https://patentassist.ai/india-patent-report-2026/#top-applicants"><img src="https://patentassist.ai/reports/india-2026/04-top25-applicants-filings-2025.webp" alt="Bar chart: top 25 patent applicants in India in 2025, led by Qualcomm with 2,561 applications and Saveetha Institute with 2,493." width="800" height="450"></a><p>Source: <a href="https://patentassist.ai/india-patent-report-2026/">PatentAssist.ai India Patent Filing Report 2026</a></p>
Top 25 patentees by patents granted, 2025
Patents granted in calendar year 2025.
Embed this ranking as a chart
<a href="https://patentassist.ai/india-patent-report-2026/#top-patentees"><img src="https://patentassist.ai/reports/india-2026/05-top25-applicants-grants-2025.webp" alt="Bar chart: top 25 patentees in India in 2025, led by Qualcomm with 1,087 patents granted, Samsung with 712 and Huawei with 638." width="800" height="450"></a><p>Source: <a href="https://patentassist.ai/india-patent-report-2026/">PatentAssist.ai India Patent Filing Report 2026</a></p>
Top 15 Indian academic filers, 2025
Indian universities, colleges and institutes, by published applications filed in 2025.
| # | Applicant | 2025 |
|---|---|---|
| 1 | Saveetha Institute Of Medical and Technical Sciences India · 2024: 1,400 | 2,493 |
| 2 | Vellore Institute of Technology India · 2024: 158 | 1,490 |
| 3 | Lovely Professional University India · 2024: 2,168 | 1,434 |
| 4 | Chandigarh University India · 2024: 1,650 | 1,311 |
| 5 | JAIN (Deemed-to-be University) India · 2024: 1,417 | 1,251 |
| 6 | SR University India · 2024: 183 | 1,080 |
| 7 | GRAPHIC ERA (Deemed to be University) India · 2024: 569 | 1,033 |
| 8 | Siksha ‘O’ Anusandhan (Deemed to be University) India · 2024: 115 | 894 |
| 9 | Noida Institute Of Engineering & Technology India · 2024: 56 | 706 |
| 10 | Sanskriti University India · 2024: 670 | 696 |
| 11 | Presidency University, Bangalore India · 2024: 0 | 625 |
| 12 | Sathyabama Institute of Science and Technology (Deemed To Be University) India · 2024: 255 | 624 |
| 13 | Manipal University Jaipur India · 2024: 334 | 609 |
| 14 | Vellore Institute Of Technology, Chennai India · 2024: 351 | 606 |
| 15 | Saveetha Engineering College India · 2024: 275 | 570 |
Embed this ranking as a chart
<a href="https://patentassist.ai/india-patent-report-2026/#top-universities"><img src="https://patentassist.ai/reports/india-2026/06-top15-academic-filings-2025.webp" alt="Bar chart: top 15 Indian academic patent filers in 2025, led by Saveetha Institute with 2,493 applications and VIT with 1,490." width="800" height="450"></a><p>Source: <a href="https://patentassist.ai/india-patent-report-2026/">PatentAssist.ai India Patent Filing Report 2026</a></p>
Among patentees, the first Indian name is Jio Platforms, 6th with 227 patents granted in 2025. The top academic patentee is IIT Madras, 10th with 193.
Methodology
Source. IP India public records (the application register and the Patent Office Journal), parsed by PatentAssist.ai. One read-only extract of 1,292,494 application records was taken on 21 October 2026. The latest publication date on record is 16 October 2026 and the latest certificate date is 30 September 2026. Charts start in 2019; grant records before then are less complete.
- Filing year: the date of filing in India. For PCT national phase applications this is the date of entry into India.
- Grant year: the certificate date. Where that is missing, the earliest grant intimation or certificate document date is used. 235,827 grants are dated by certificate and 118,556 by document. 255 records with a grant date before the filing date are dropped.
- Same publication window: a year-Y filing is counted only if it was published by 21 October of year Y+1. Every growth figure uses this basis, so recent years are not flattered or penalised by publication delays.
- Office: the 5th digit of the application number (1 Delhi, 2 Mumbai, 3 Kolkata, 4 Chennai).
- Indian or foreign applicant: the first-named applicant's country (99.6% coverage).
- Applicants: names normalised with the same key as PatentAssist's rankings pages; placeholder names are dropped.
- Academic: an applicant name matching the rankings keyword list (university, college, institute, IIT, NIT, IISc and similar) or CSIR.
- IPC: each distinct subclass counts once per application (97.7% coverage). Growth rankings need at least 300 filings in 2025 and 100 in 2022. New or reclassified subclasses (G06V, B64U, H10N, G16Y, A01P, B61B, H10K) are excluded.
- Timing: granted applications only. Intervals below zero or over 20 years are dropped (16 cases). 61.6% of FER dates come from the record field and the rest from document dates; where both exist they agree in 82% of cases.
- Outcomes: applications filed in 2018 to 2020, staged from their IP India status.
Check against official totals. The CGPDTM Annual Report 2024-25 (page 9, "Trends in Patent Applications") reports:
| Financial year | Filed: on record / official | Granted: on record / official |
|---|---|---|
| 2023-24 | 85,245 / 92,168 (92.5%) | 103,027 / 103,057 |
| 2024-25 | 103,188 / 110,375 (93.5%) | 33,486 / 33,504 |
Grants match almost exactly. Filings on record fall short because some applications are never published. For total applications filed in a year, cite the official figure: 110,375 in 2024-25.
Limitations
- Published applications only. About 7% of officially counted applications are never published. 2025 filings are about 81% on record and 2026 about 47%, and early-published (often Indian and academic) applications appear first. That is why growth is measured on the same publication window.
- Status strings can be stale. 18.6% of 2018 to 2020 filings have no usable status (26% of foreign filings), and 8.7% still read "Awaiting Request for Examination". Abandonment and withdrawal shares are lower bounds.
- Timing covers granted applications only.
- Campuses stay separate. Name merging does not combine an institution's campuses or a company's subsidiaries.
- The live rankings may differ slightly. They count from a search facet capped at 1,000 spellings and date grants by certificate only.
- The figures describe what happened, not why. This report makes no claim about the causes of the trends.
How to cite
The charts and tables are free to use with attribution and a link to this page.
PatentAssist.ai (2026). India Patent Filing Report 2026. Analysis of IP India records as of 21 October 2026. https://patentassist.ai/india-patent-report-2026/
Journalists and researchers: write to contact@patentassist.ai for comment, a custom cut of the data, or the full charts in PNG.
Explore the data yourself
- Free Indian patent search: look up any published application or granted patent.
- Top patent filers in India, 2025: live rankings by filings, grants, universities and field.
- Indian patent timeline and Form 18 request for examination.
- All IP India guides.